Blinkit | Peak Assist
Zero-scroll ops for the 10-minute window.
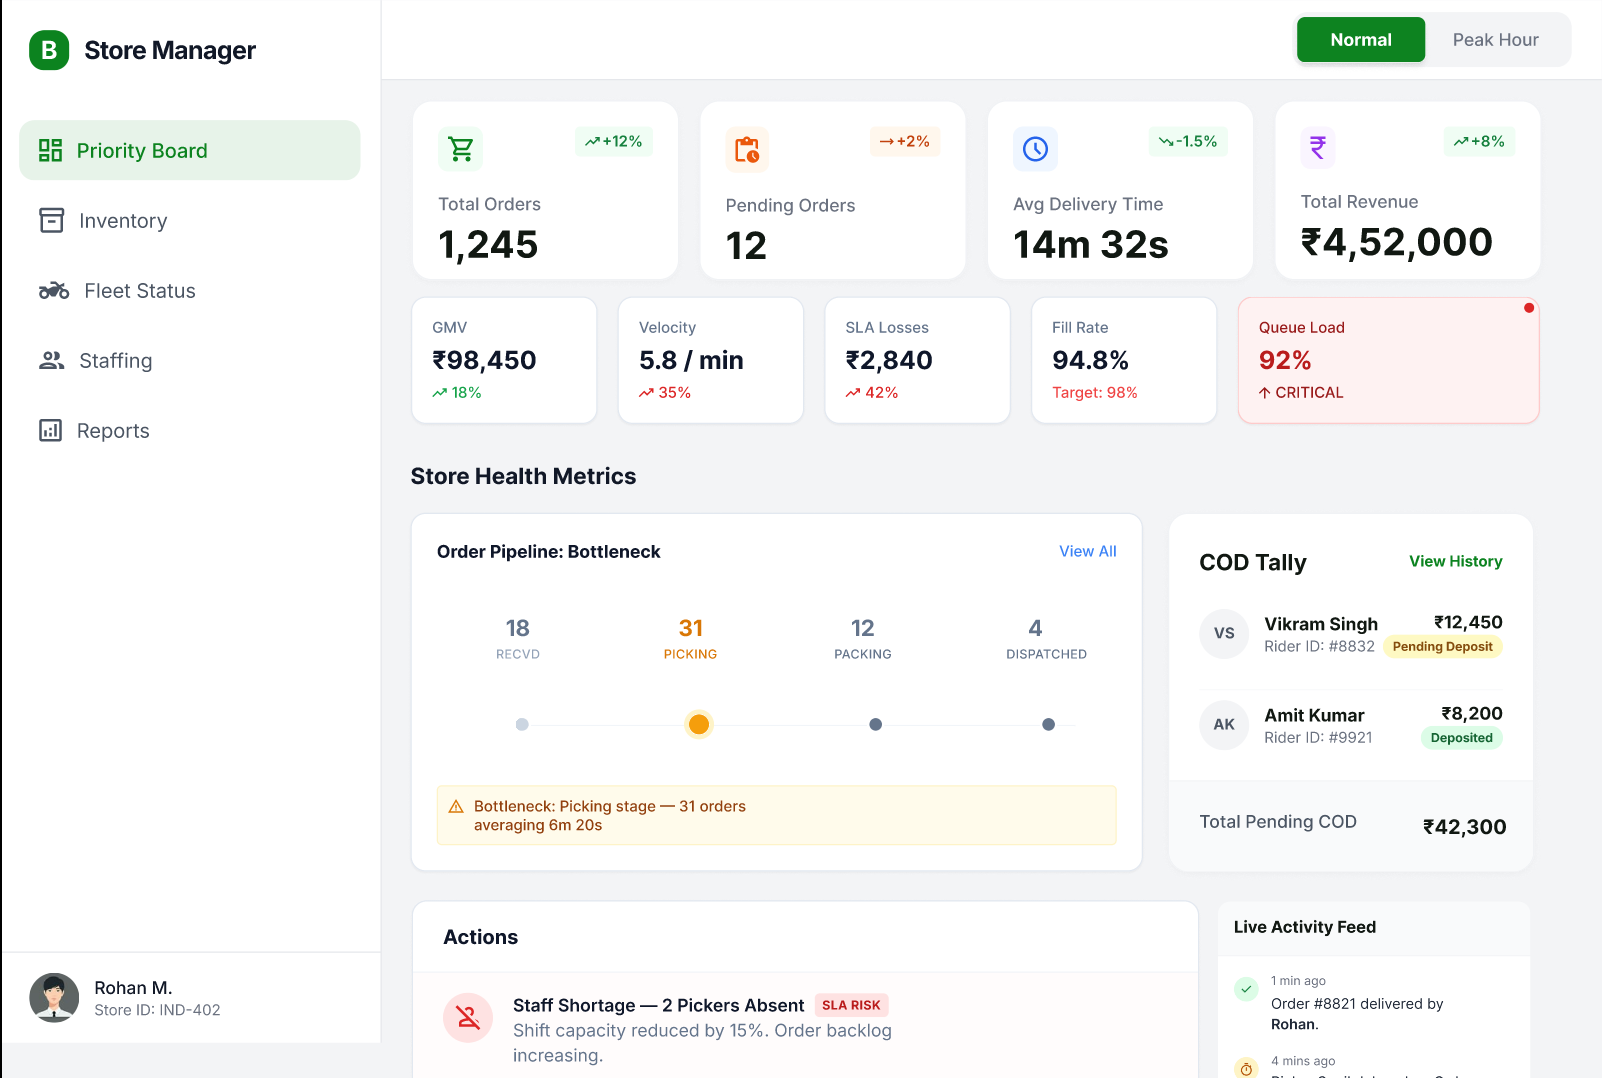
Baseline ops view: order throughput, pipeline health, and store metrics at a glance — normal state, no surge intervention needed.
- →Header strip: total orders, pending, avg delivery time, GMV, velocity, and SLA losses live
- →Order Pipeline shows bottleneck stages — receiving, picking, packing, dispatch — with counts
- →COD Tally, Actions panel, and Live Activity Feed surface emerging issues before they escalate
Peak Assist was designed around one constraint: during a Blinkit surge, the duty manager has 90 seconds to identify and resolve a bottleneck before SLA cascades. The existing dashboard required 4–6 navigation steps and multiple context switches to do the same. I redesigned the ops layer around the peak mode state — the system detects surge, surfaces only what changed, and collapses every action to a single tap.
The 10-minute window nobody was designing for
In quick commerce, SLA failure isn't a slow decay — it cascades. One delayed order triggers a reassignment, which shifts a rider's route, which delays two more orders. The duty manager has a 90-second window to intervene before it compounds. The existing Blinkit ops dashboard was designed for monitoring, not intervention. It showed everything equally, which meant the most critical signal was buried in the same view as ambient data.
Surge state as a design primitive
Most ops dashboards are static — the same layout whether demand is at 40% or 140% of capacity. Peak Assist introduced surge state as a first-class design primitive. When OPH crosses threshold, the system doesn't just alert — it reconfigures. Non-urgent panels collapse, the priority queue surfaces, and the Quick Actions panel expands to the most likely responses. The manager doesn't have to decide what to look at. The dashboard already made that call.
Designed from incident logs, not assumptions
The six Quick Actions weren't chosen arbitrarily. I mapped the most common duty manager interventions from shift incident logs: rider reallocation, SLA extension, zone override, escalation to ops lead, manual re-pick assignment, and inventory hold flag. Together they covered 80%+ of logged P1 incidents. Designing from real incident patterns meant the one-tap actions matched the decisions managers were already making — just faster.
The 4-layer architecture
Monitors orders-per-hour against capacity threshold. Triggers Peak Assist mode automatically — no manual toggle needed.
Severity-scores every active order in real time. Critical, At Risk, On Track — the queue is always ranked, never flat.
Six pre-built responses for the most common surge scenarios. Each shows downstream impact before the manager confirms.
Every action taken during Peak mode is logged with timestamp and outcome. The shift handover report populates itself.